// PRODUCT 05 / 05
Enterprise command center for omniscient warehouse operations.A unified dashboard that aggregates data from every site, everysystem, and every shift — delivering real-time KPIs, exceptionalerting, and predictive analytics to operations leadership.
Aggregates data from
// OVERVIEW
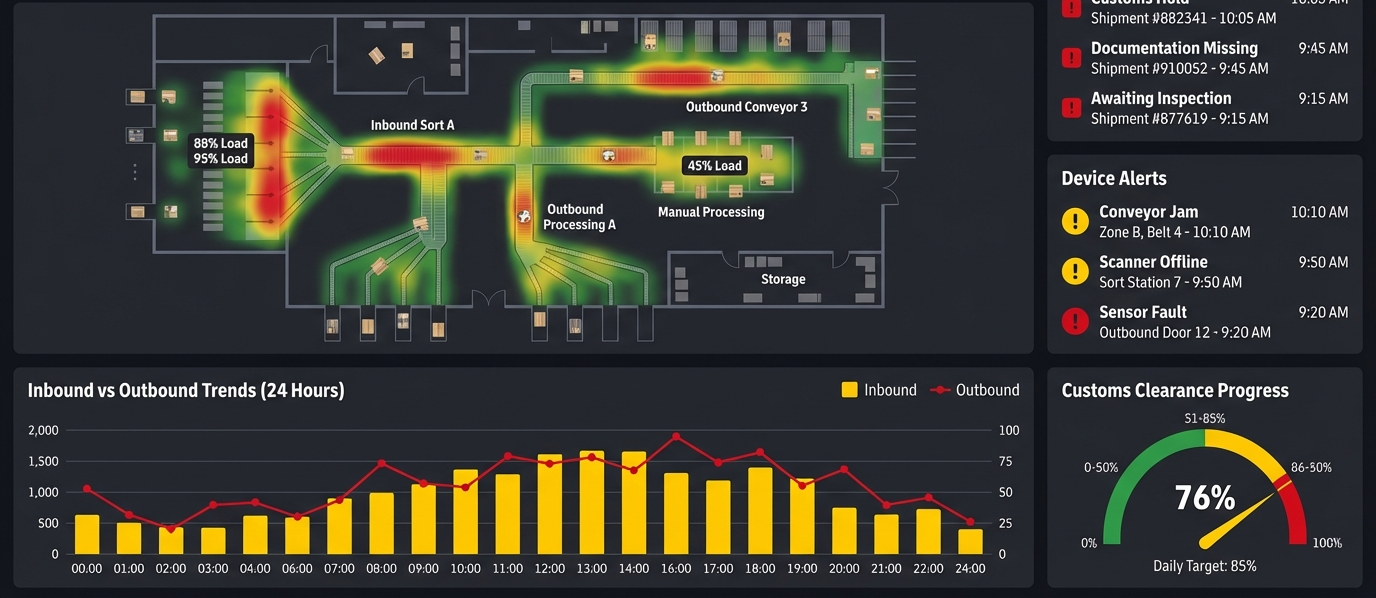
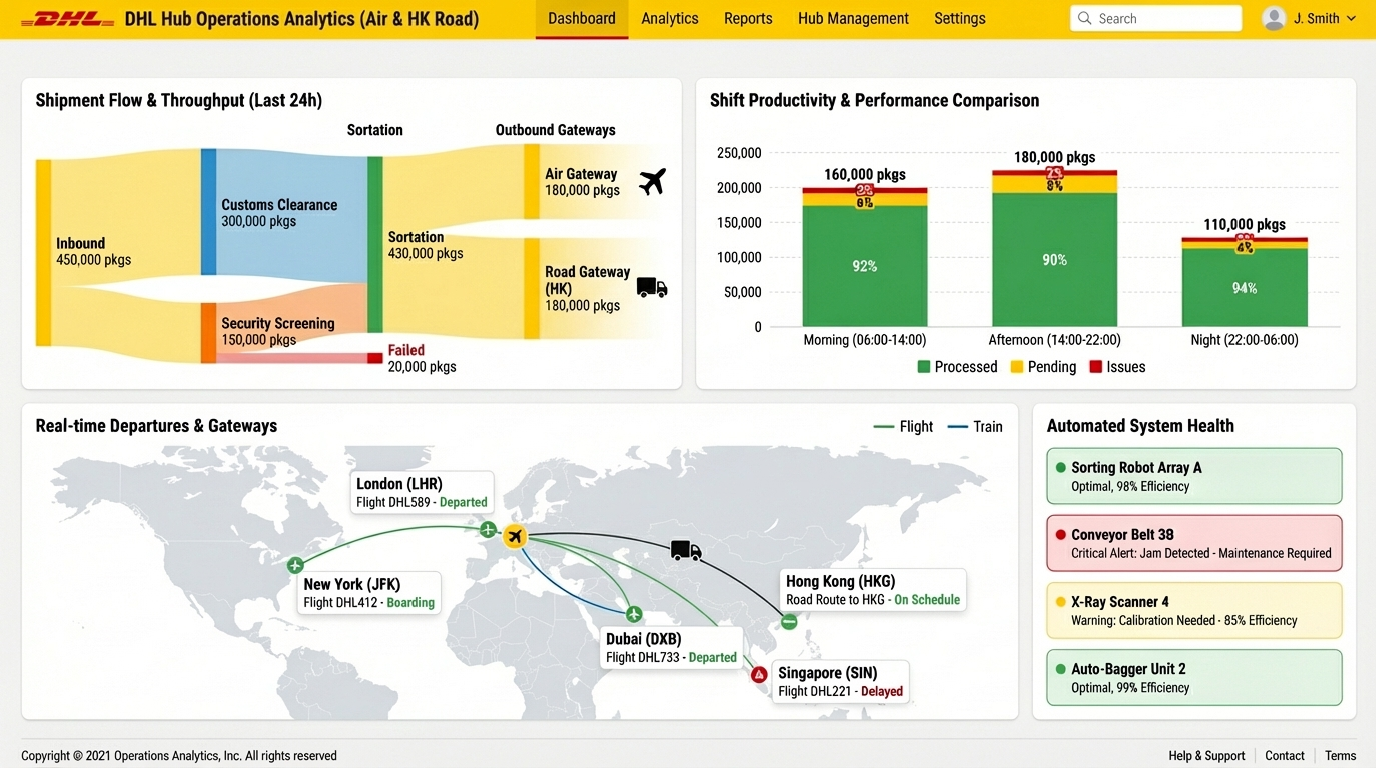
CONNING.TOWER is the single pane of glass that gives operationsleadership the complete picture — in real time. It aggregates liveoperational data from all WEDOFUTURE modules and third-party systemsacross every warehouse location, enabling faster decisions andproactive exception management.
// ANALYTICS
CONNING.TOWER's built-in analytics engine continuously learns fromyour operational patterns — identifying recurring bottlenecks,predicting peak demand windows, and recommending staffingadjustments before issues manifest on the warehouse floor.
// SHIFT HANDOFF
Every shift transition generates an automated briefing documentsummarizing outgoing performance, incoming priorities, andunresolved exceptions — distributed to shift supervisors andoperations managers before the new shift begins.
// TECHNICAL SPECIFICATIONS
| Site Capacity | Up to 50 sites per enterprise instance; unlimited instances for global deployments |
| Data Sources | All WEDOFUTURE modules; SAP ERP, Oracle ERP, Microsoft Dynamics; REST API for custom sources |
| Refresh Rate | Real-time (sub-second) for critical KPIs; configurable polling intervals for non-critical data |
| Data Lake | Time-series data lake with 5-year retention; supports ad-hoc SQL queries and BI tool direct connect |
| Deployment | Private cloud (AWS, Azure, GCP) or on-premise; multi-tenant SaaS available |
| API | GraphQL API for custom dashboard development; webhooks for external system triggers |
| Predictive Models | Demand forecasting (ARIMA + ML ensemble), anomaly detection (isolation forest), OEE prediction |
| KPI Library | 500+ pre-built KPIs covering throughput, OEE, labor, inventory, order accuracy, and exception rates |
| Custom KPIs | Visual KPI builder with drag-and-drop formula editor; no code required |
| Dashboards | Configurable role-based dashboards; shareable across teams; supports 4K wall-mounted displays |
| Reporting | Scheduled PDF/CSV reports; ad-hoc report builder; direct Power BI and Tableau connectivity |
| Alerts | Threshold-based and ML anomaly-based alerting; routes to email, SMS, Teams, Slack, and voice |
// MULTI-SITE COMPARISON
| Site | Location | Throughput/hr | OEE | Order Accuracy | Open Alarms | Status |
|---|---|---|---|---|---|---|
| DC Shanghai | Shanghai, CN | 4,820 | 91.2% | 99.97% | 2 | Normal |
| DC Shenzhen | Shenzhen, CN | 3,650 | 88.4% | 99.93% | 5 | Attention |
| DC Singapore | Singapore, SG | 2,100 | 94.7% | 99.99% | 0 | Normal |
| DC Frankfurt | Frankfurt, DE | 1,890 | 86.1% | 99.88% | 8 | Attention |
| DC Los Angeles | Los Angeles, US | 3,240 | 89.5% | 99.91% | 3 | Normal |
| DC Sydney | Sydney, AU | 1,420 | 92.3% | 99.95% | 1 | Normal |
// GET STARTED
CONNING.TOWER gives operations leadership a single operational truthacross every site. Book a 60-minute live demonstration showingmulti-site aggregation, KPI dashboards, and predictive alertsrunning against a simulated warehouse network.
 WEDOFUTURE